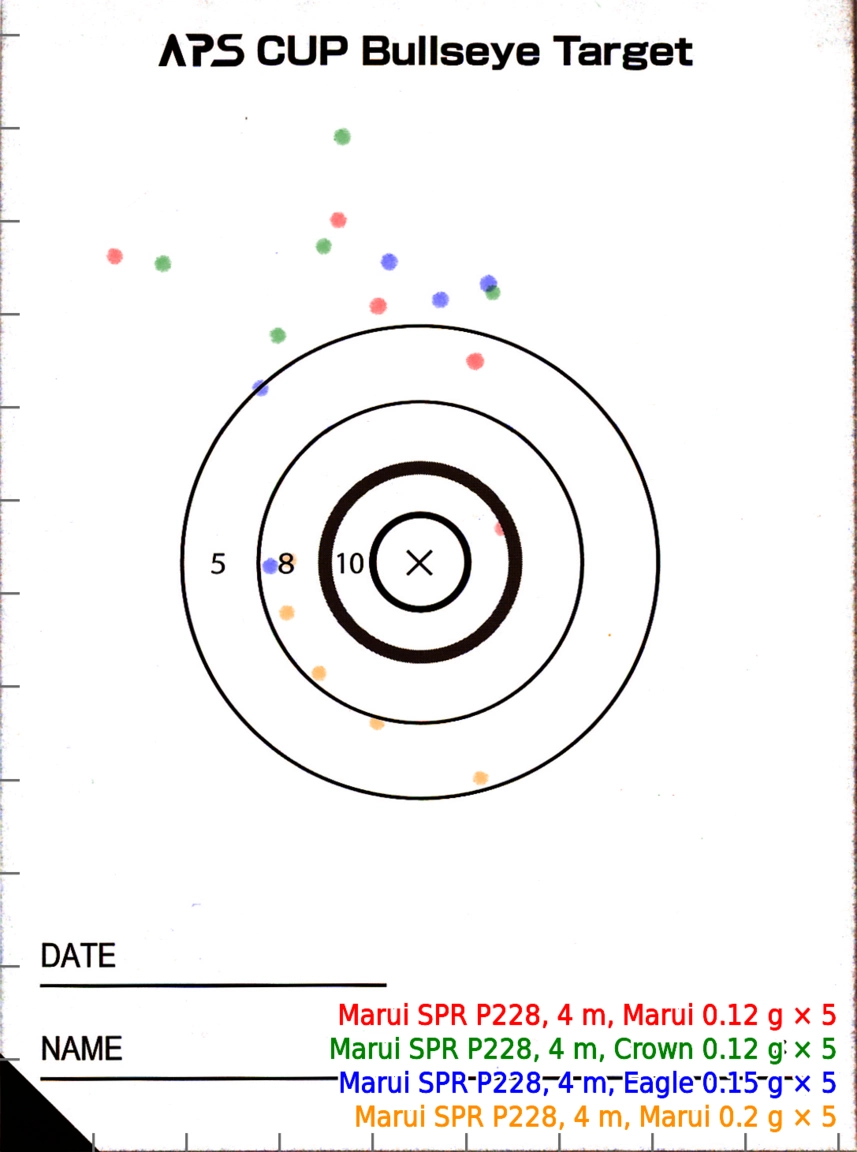
The opportunity arose to scan multiple scatter plots (airsoft gun impact points) and overlay them on a single image to compare the distributions. First, I adjusted the position and rotation of the scanned images to overlap. Then, I gave each a different color to distinguish the data series. Although I could have done these processes interactively using image editing software, I automated them using Hugin, panorama stitching software, and ImageMagick 6, a software suite to edit and manipulate images.
Adjust Position and Rotation of Each Image
To overlap the plot area, adjust the position and rotation of each scanned image. In this post, I use the align_image_stack command from Hugin. First, select aligning images as the operation mode and specify the output prefix with -a aligned-. In flatbed scanners, the image sensor has three degrees of freedom relative to the object: vertical position, horizontal position, and rotation. Therefore, the only additional option required is -i to optimize the image center shift.
align_image_stack -a aligned- -i "$input_1" "$input_2"
Monochromatize Each Image
To convert every aligned image above to a different monochromatic color, I use the convert command from ImageMagick. First, convert the images to grayscale using the -colorspace Gray option. Next, convert black to red using the +level-colors red, option.
convert -colorspace Gray +level-colors red, "$input" "$output"
Composite Images
To composite the monochromatic images above, use the -composite option of convert. The -compose multiply option darkens the overlapping colors.
convert -composite -compose multiply "$input_1" "$input_2" "$output"
Trim Margins
To trim the margins of the composite image above, I use several options in convert. First, correct the skew of the image using the -deskew 40% option. Then, trim the margins using the -trim option. Because the margins of scanned images are not all white, allow for color differences using the -fuzz 80% option. Finally, adjust the canvas size to fit the image using the +repage option.
convert -deskew 40% -trim -fuzz 80% +repage "$input" "$output"
Add Scales and Legend
Add scales to the trimmed image above based on the scan resolution. For example, at a pixel density of 300 PPI, a distance of 10 mm would be:
\[ \frac{300\ [\mathrm{px/in}]}{25.4\ [\mathrm{mm/in}]} \times 10\ [\mathrm{mm}] \approx 118\ [\mathrm{px}]. \]
To draw a line segment between the start and end points using this value, use the -draw 'line 118,0 118,16' option of convert. To set the color and thickness of the line segment as an outline, use the -stroke DimGray -strokewidth 2 options.
convert -stroke DimGray -strokewidth 2 -draw 'line 118,0 118,16' \
    "$input" "$output"
Additionally, add a legend for the data series. First, use the -gravity SouthEast option of convert to reference the bottom right corner of the image. Next, specify a font and its size using the -font Cantarell-Regular -pointsize 36 option. Now draw a non-transformed string twice using the -annotate 0 'Series 1' option. The former is a font outline in the background color, while the latter is a filled font.
convert -gravity SouthEast -font Cantarell-Regular -pointsize 36 \
    -stroke white -strokewidth 8 -annotate 0 'Series 1' \
    -stroke red -strokewidth 0 -fill red -annotate 0 'Series 1' \
    "$input" "$output"
Bash Script Example
Combining the above processes, you can automatically composite scanned plots. In a real-world application, I have published the composite_plots.sh Bash script on GitHub. The image at the beginning of this post is an example of its execution.
No comments:
Post a Comment